A smarter way: how analytics apps are solving your optical network challenges
Network providers are continuously striving to maximize ROI, while improving system performance, network efficiency, and service availability. To make this possible the photonic layer is evolving to become increasingly intelligent and programmable, with extensive real-time monitoring points and knobs that can be adjusted for different applications. How can operators take advantage of these flexible next-gen technologies without getting bogged down by increased operational complexity or data overload?
Advancements in software applications now make it possible to leverage analytics to change the game when it comes to simplifying next-gen photonic network operations. These advancements abstract operational complexity and give providers unprecedented visibility into their optical networks.
I know what you are thinking – you’ve heard this before. Since the term Software-Defined Networking (SDN) was first introduced a decade ago, the value that increased automation coupled with advanced software can bring to optical networking has been a hot topic. Although the benefits of SDN became clear rather quickly, applying it in real optical networks required more than a flip of a switch. Advancements in hardware and software were required, which took time to put into practice.
But that time has come, and today, these advanced software applications that combine SDN with real-time analytics are being used across real optical networks to make them smarter, by extracting the most value from existing network resources across the various stages of the photonic network lifecycle.
How can we say that for sure?
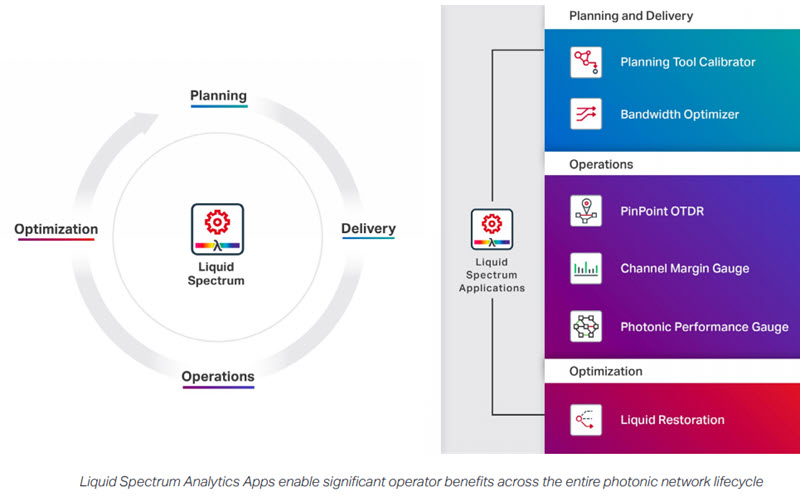
We have first-hand experience with our customers, who are using Ciena’s Liquid SpectrumTM Analytics Apps such as PinPoint OTDR, Channel Margin Gauge and the new Photonic Performance Gauge, that combine real-time analytics and increased automation with Ciena’s proven MCP domain controller, to simplify operations by abstracting complexity associated with flexible next-gen technologies. To be specific, more than 90 of our customers – network providers that include telecom service providers, MSOs, subsea operators, and large enterprises – are already using these advanced software applications to transform their photonic network operations and gain actionable insights based on the current state of their network.
Just how are Liquid Spectrum apps redefining day-to-day photonic network operations and helping providers realize the benefits of the Adaptive NetworkTM? Let me explain, by sharing real stories about today’s operational challenges faced by the network and services operations teams.
Proactive fiber monitoring and faster troubleshooting
An essential part of day-to-day optical network operations is the ability to fully monitor the state of the fiber plant and quickly address any current issues, such as excessive attenuation, improper splices, and fiber breaks. Obviously when a fiber cut occurs, it is crucial that traffic is restored as quickly as possible. But when you are working at the NOC, it does not end there. You must quickly pinpoint the exact location of the problem, which traditionally means a lengthy and expensive troubleshooting process to localize the failure.
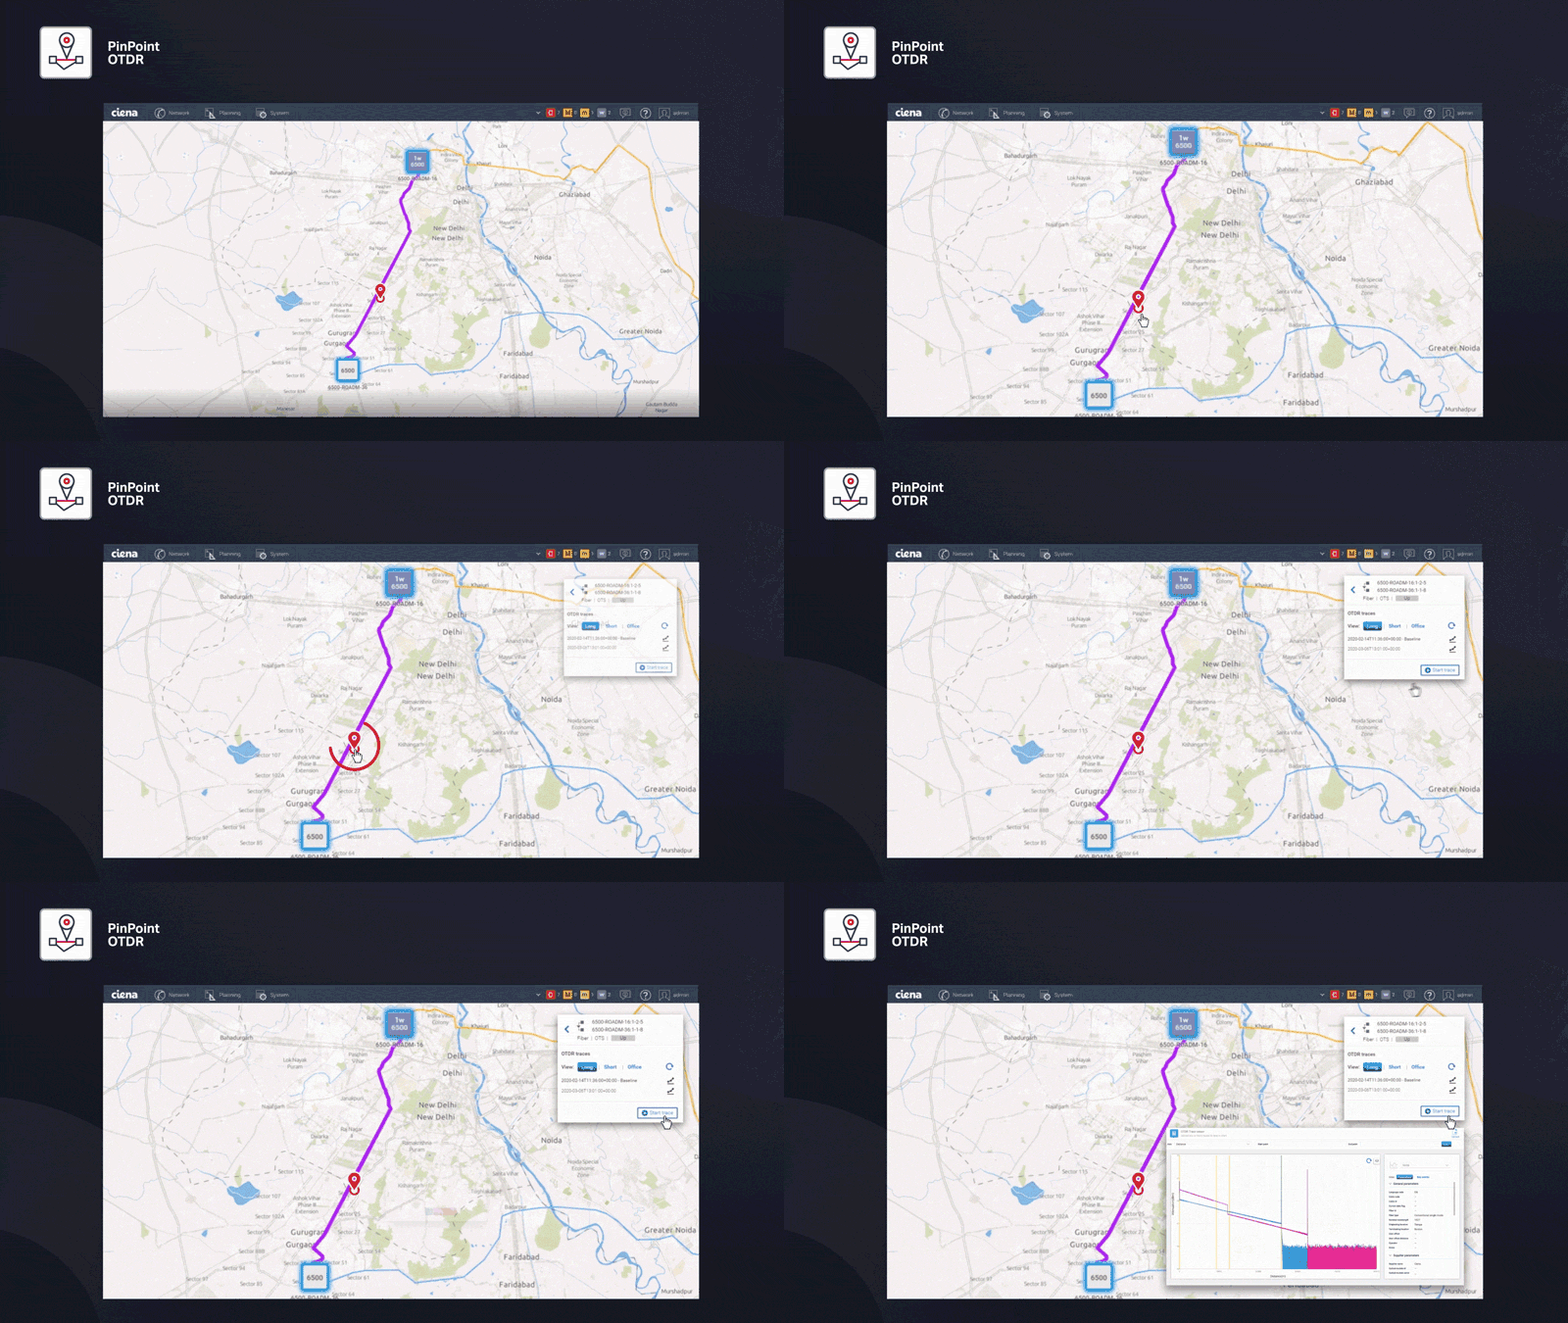
Instead, with PinPoint OTDR, providers, like Bharti Airtel, can precisely locate potential trouble spots – even over traffic carrying links - reducing the risk of outages and accelerating repair times from days to hours. PinPoint OTDR leverages Optical Time-Domain Reflectometers (OTDRs) that are built into the photonic line system to accurately calculate the distance to issues and anomalies in the fiber plant. This makes it easy to precisely pinpoint the fault location at the NOC and quickly send a technician to the exact location. Operators can also initiate in-service OTDR traces for proactive maintenance and to remotely validate that installation, maintenance, and repairs have been properly executed.
Gaining instant visibility into network efficiency
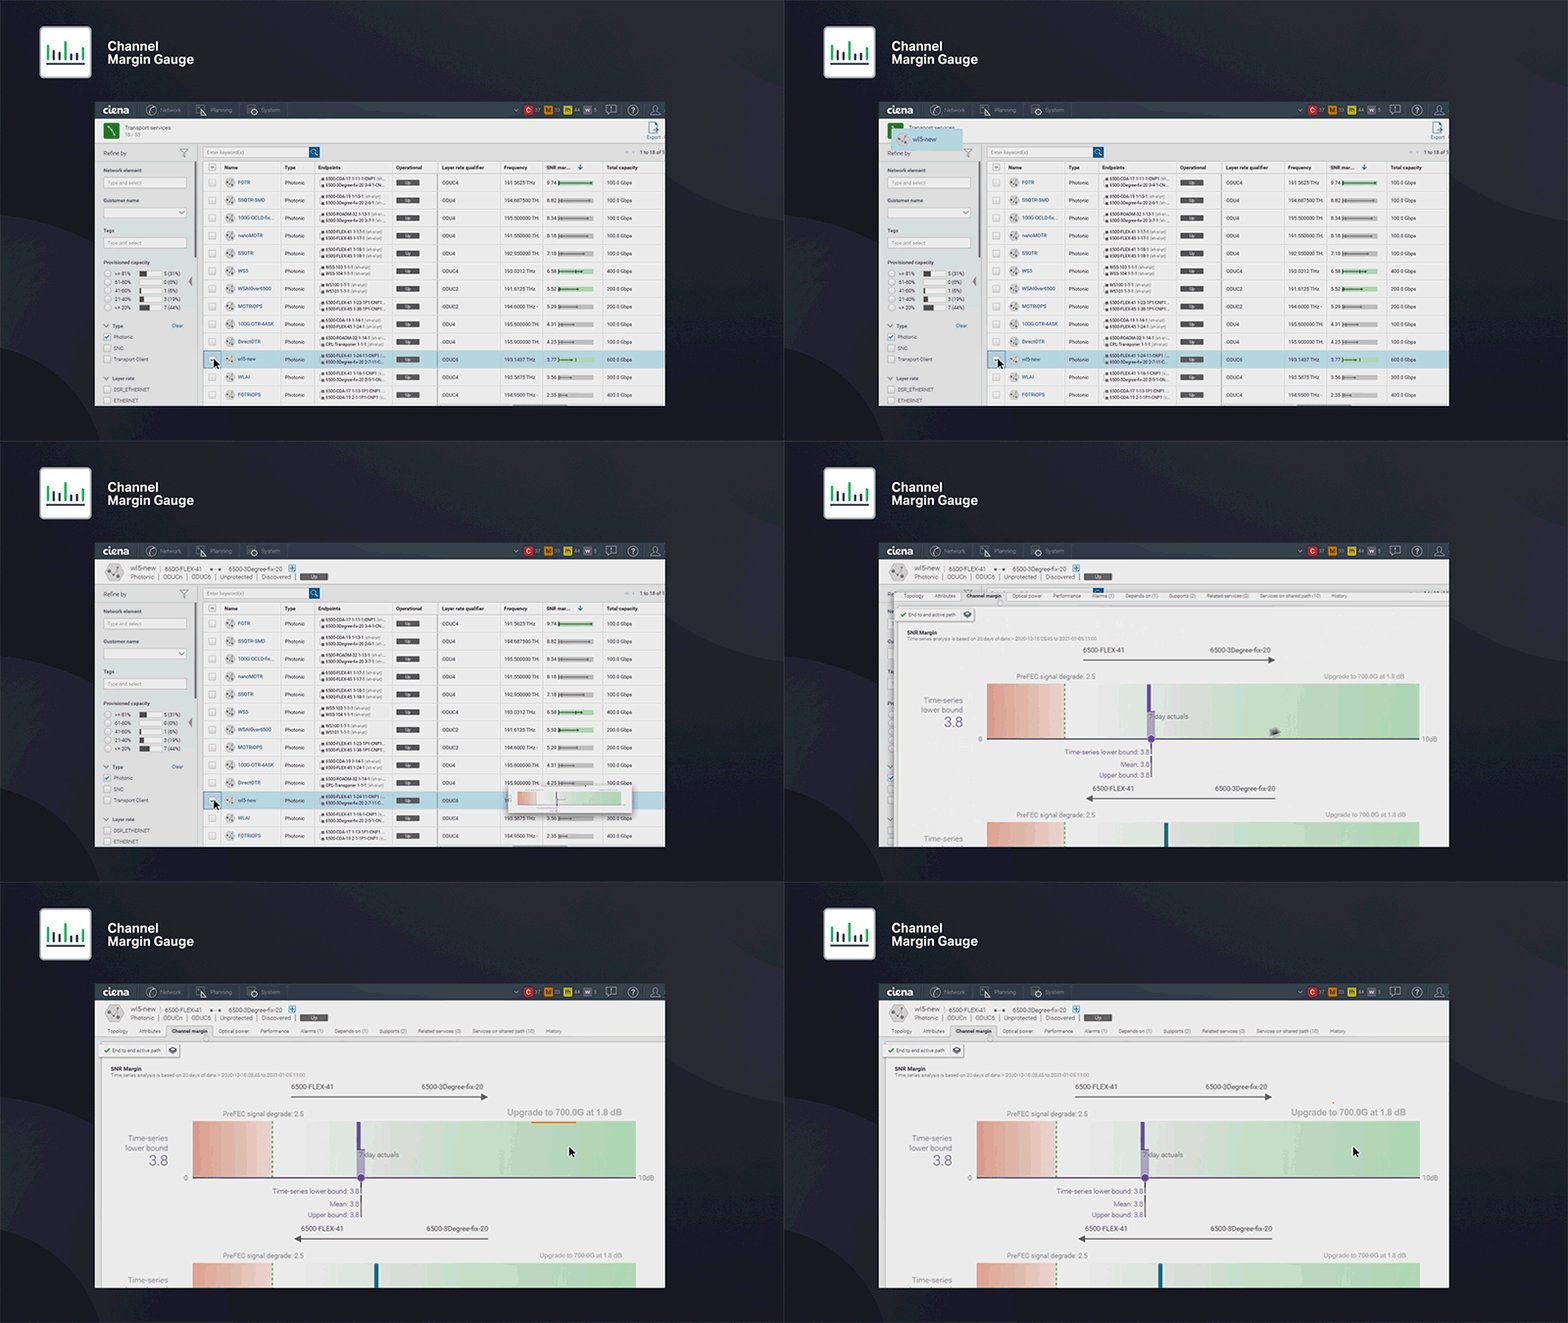
Channel Margin Gauge (CMG) uses real-time performance metrics to provide an easy-to-read snapshot of every active channel’s performance, intuitively letting you know if the channel is performing as expected, if there is a need to investigate because margin is lower than expected, or if the channel has plenty of margin making it a capacity upgrade candidate channel. This means that from the NOC, you can better match optimal capacity to available margin, and even turn-up capacity on demand, temporarily borrowing available margin of an upgrade candidate channel to increase the capacity delivered by the network.
Today, more often than not, operators are using this advanced software application to significantly enhance day-to-day operations. A perfect example of the value provided is explained by Dacian Demeter, Principal Technology Architect at TELUS, whose next-gen optical network extends 6,000km across Canada: “By displaying the real-time SNR margin for all of our photonic services, the Channel Margin Gauge application is an essential troubleshooting tool that allows us to ensure that the margin required in our network is maintained.” With CMG, operators have the power at their fingertips to not only understand what is happening in their network, but also to gain actionable insights that would otherwise not be possible.
“By displaying the real-time SNR margin for all of our photonic services, the Channel Margin Gauge application is an essential troubleshooting tool that allows us to ensure that the margin required in our network is maintained.” - Dacian Demeter, Principal Technology Architect at TELUS
We also have another customer using CMG for real-time monitoring of channels across a fixed-grid long-haul network consisting of short (about 60 miles) and long (about 1100 miles) spans, over buried and aerial fiber. In this case, the service provider can proactively analyze channel performance after an event such as a fiber repair/splice and compare the performance of different coherent modems across similar routes.
Optimizing ROADM section performance
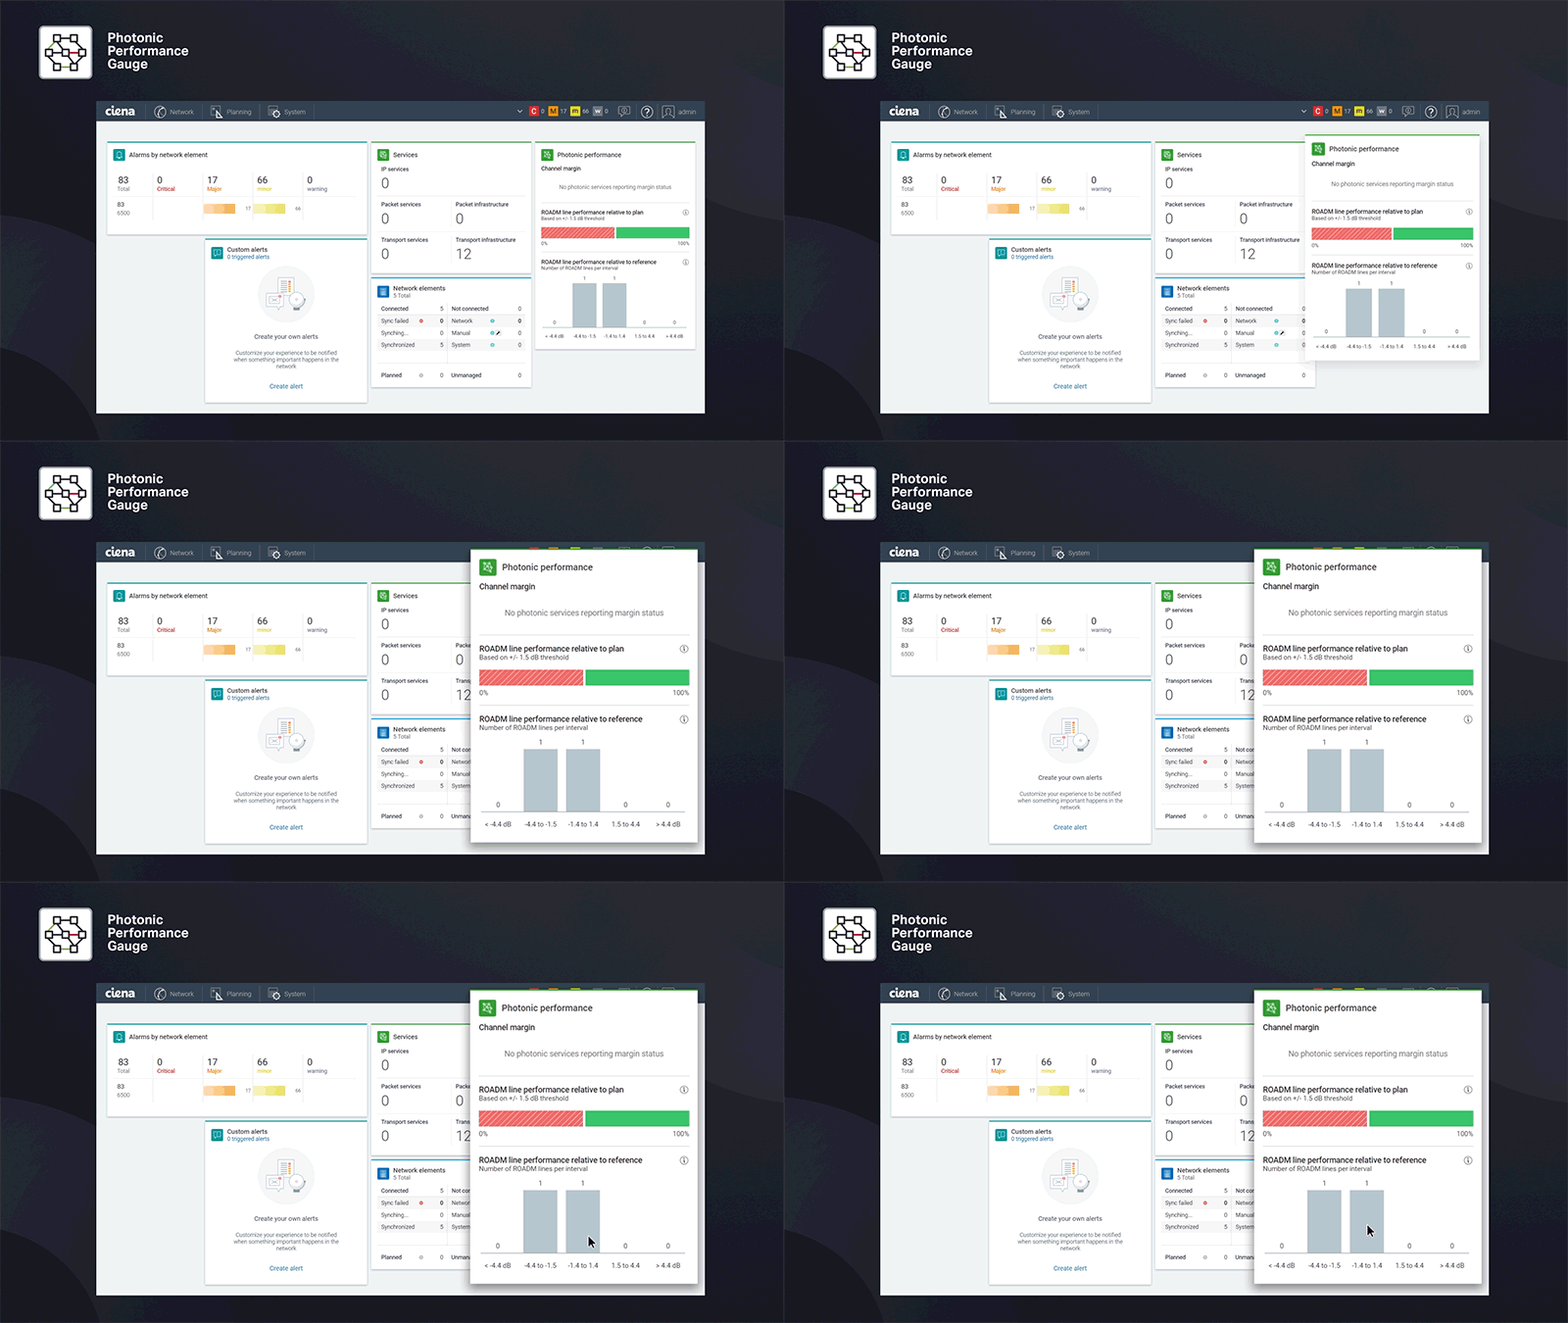
To solve this longtime challenge, Ciena is introducing Photonic Performance Gauge (PPG), the newest addition to our family of Liquid Spectrum Analytics Apps, which provides unprecedented visibility of real-time SNR performance for ROADM-to-ROADM links in the network. It is like driving across town using a traditional static map versus using a smart phone app that leverages real-time data to know exactly where the construction, potholes or congestion is. This continuously changing information is important to factor into decision-making – once you start to use it, you cannot imagine driving without that increased visibility and assurance!
PPG uses new real-time performance metrics within the line system and advanced end-to-end photonic layer automation to provide instant visibility into the state of the photonic network - even on ‘dark’ sections of the network where no wavelengths are deployed—an industry first! Why is this valuable? A provider could use this insight to allow routing engines to weight links differently in path calculations or may choose to perform maintenance at these locations to improve performance, and therefore, capacity.
PPG uses new real-time performance metrics within the line system and advanced end-to-end photonic layer automation to provide instant visibility into the state of the photonic network - even on ‘dark’ sections of the network where no wavelengths are deployed—an industry first!
To illustrate just how powerful this app is, consider a Layer 0 control plane enabled network that offers multiple restoration paths if the home path fails. But how do you know for sure that the restoration path can carry the capacity required when you need it? The answer is that today, you just don’t know – it’s a ‘blind spot’ in the network. Although it may have been able to carry the capacity required when the network was initially designed, there is no way to guarantee that it can carry the capacity required months later – and this can potentially result in a network outage. With PPG, providers can monitor the health of optical restoration paths, detect silent failures, and proactively fix problems, preventing service interruption.
Enabling a more intelligent optical network 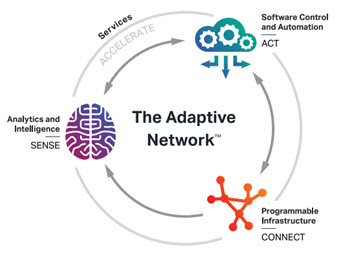 As providers continue their network evolution journey, advanced software tools and increased automation are required to fully operationalize and realize the benefits associated with a modernized network. Fortunately, Liquid Spectrum Analytics Apps are already helping providers abstract operational complexity and provide unprecedented visibility, making it fast and easy to make intelligent decisions based on the current state of the network – and fully realize the benefits of the Adaptive Network.
These advanced software applications, along with the rest of the suite of Liquid Spectrum applications, are continuing to evolve to provide more value, across the entire photonic network lifecycle, so that providers can achieve the optimal balance of network performance, efficiency, and availability.
Are you ready to make your network transformation smarter?

