Optical Network Expert Series: Leveraging network analytics for unprecedented control and monitoring
Network providers need more than real-time telemetry data to understand and optimize their networks. The vast amount of data generated by today’s coherent modems provide important information about what is happening in the network but can make it difficult to view or interpret in a timely manner without appropriate analytical tools.
Fortunately, advancements in software-defined networking enable providers to leverage data analytics combined with software control and automation to yield unprecedented visibility into their networks, and insights to maximize network efficiencies throughout the life of their photonic network.
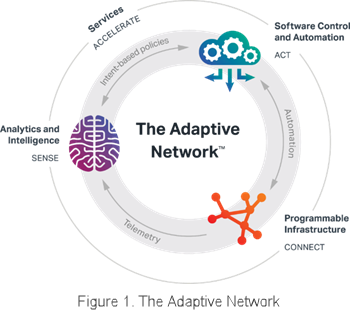 Ciena’s Liquid Spectrum applications perform this role in the Adaptive NetworkTM(see Fig. 1). Liquid Spectrum uses analytics and intelligence to understand data gathered from the programmable optical infrastructure and “sense” network conditions, to generate actionable insights from the data. The insights are fed into centralized, policy-based software control and automation tools, which “act” on the insights to ensure the infrastructure is responsive and agile.
One important use case of Liquid Spectrum is determining how much signal-to-noise ratio (SNR) margin is present in a channel at any given time. This provides an instant health check of how the channel is performing and whether the channel has additional margin available that can be converted into capacity. Following are two examples of how Liquid Spectrum applications can be applied to maximize network efficiencies and optimize operations.
Applying analytics to monitor SNR margins and maximize capacity
During the planning phase of the network, operators allocate system margin in their networks to ensure they always have a high quality of transmission (QoT), even when the network reaches its End Of Life (EOL). This means that in most networks today, the margin allocation is often more generous than necessary to ensure EOL system performance, resulting in extra margin that is wasted instead of used to address new bandwidth demands and transport more traffic capacity over the network.
The Liquid Spectrum Channel Margin Gauge (CMG) scans all modems in the network and performs a time-series analysis of the effective SNR (ESNR) measurements provided by the modems. The Channel Margin Gauge app displays this analysis in an easy-to-read graphical format, making it convenient for providers to quickly quantify and visualize the margin, and determine if they can run their networks at higher capacities.
Figure 2 shows an example of a field deployed channel measured over a 90-day period where ESNR metrics were taken from the modems every 15 minutes. The data revealed margin fluctuations of about 0.5 dB that lasted in duration from hours to days. The data also revealed one outlier event in which the margin dropped to near zero during one 15-minute interval. This time series analysis has high value to providers because the trends help estimate the margin that can be accessed safely from the channel in the near term. For example, an engineer might determine from this data that it is safe to take 2 dB from the ESNR margin under current operating conditions for the next few days or even weeks. While there is the potential risk of another similar outlier event, the channel would still likely meet its QoT requirements given the transitory nature of the monitored event. ESNR margins are often substantial, in fact converting the margin to capacity can potentially double the capacity of a channel.
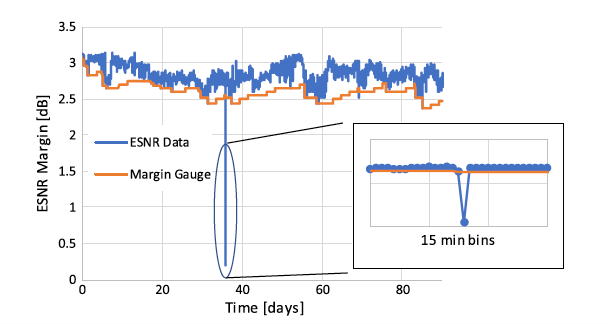
Figure 2. Long-term performance data for a single channel, showing ESNR data taken at 15-minute intervals and a margin gauge metric for minimum margin estimation
Figure 3 (below) is an example of the SNR margin graph displayed by Channel Margin Gauge for a specific bidirectional channel that has been identified as an upgrade candidate, because it has enough SNR margin to be upgraded. This app allows providers to determine if they can turn-up capacity on-demand on this channel by temporarily borrowing margin available by up-shifting the capacity of the modems that correspond to the transponders of that link.
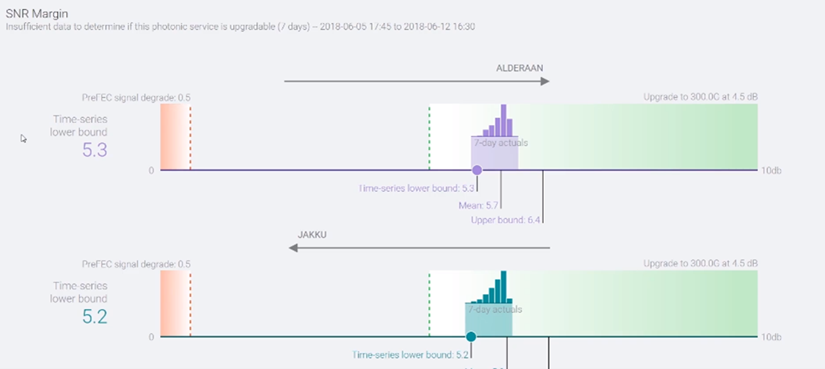
Figure 3 Example of an SNR margin graph displayed by Channel Margin Guage
As with historical data, however, the SNR margin analysis is retrospective rather than predictive. To predict available SNR margin, providers need to correlate the margin gauge changes with key operational parameters that influence the margin.
Applying machine learning to fiber characterization for optimal system performance
Machine learning provides value in determining parameters within the network that are not directly measurable by the equipment itself but can be discovered though analytics. One example is extracting characteristics of the transmission fiber. Fiber characterization is important in near-zero margin operating strategies because the type of fiber needs to be known to ensure optical system performance. In fact, the optimal launch power for a fiber can vary significantly from one fiber type to another, even by several decibels, and setting the wrong target power can incur a significant SNR penalty. Yet fiber type is not always obvious. It turns out that in practice many cables contain a variety of fiber types and it is not unusual for a fiber type to be misidentified. Accurately characterizing fiber is a labor-intensive process and continues to be a topic of extensive research.
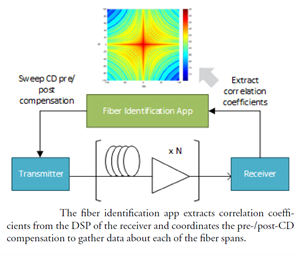 What if providers had a fiber identification application at their fingertips to address this challenge? An app that uses the coherent modem DSPs in the network to gather real-time data on the propagation and noise characteristics (both linear and nonlinear), between a transmitter and receiver, for any fiber type? This application would then use machine learning, artificial neural networks (ANNs) and a state-of-the-art pattern recognition algorithm to identify fiber types in a network based on the DSP metrics.
Using a classic supervised learning methodology to train and test the algorithm on extremely large datasets, proved that it is possible to predict the type of fiber installed with better than 90% accuracy. This valuable insight enables providers to accurately determine launch power of their transponders, significantly improving system performance and stability. Fiber-type identification is just one example of insight that can be provided by leveraging analytics and machine learning capabilities. Ultimately, the goal is to provide a means to model the network so that future states can be evaluated via software defined applications.
Offering network providers more capacity for less
Network providers have a very real opportunity to achieve a near-zero margin network design with the latest innovative hardware and software technologies available today. This article highlights one approach used in this strategy: the application of network analytics to understand, monitor, and control the SNR margin with the goal of maximizing capacity. Because the approach mines capacity from available system margin in the network, it lowers cost per bit for data transport such that providers can offer much more to their customers, for less.
Check out the other installments in the blog series:
- Intro: How near-zero margin networking changes network economics
- Part 1: Designing programmable infrastructure to achieve near-zero margin networks
- Part 3: Applying AI to maximize capacity and Quality of Transmission by David Côté
Or want to get a more in-depth understanding of this new approach now? Download the full paper "Practical Considerations for Near-Zero Margin Network Design and Deployment" today.

